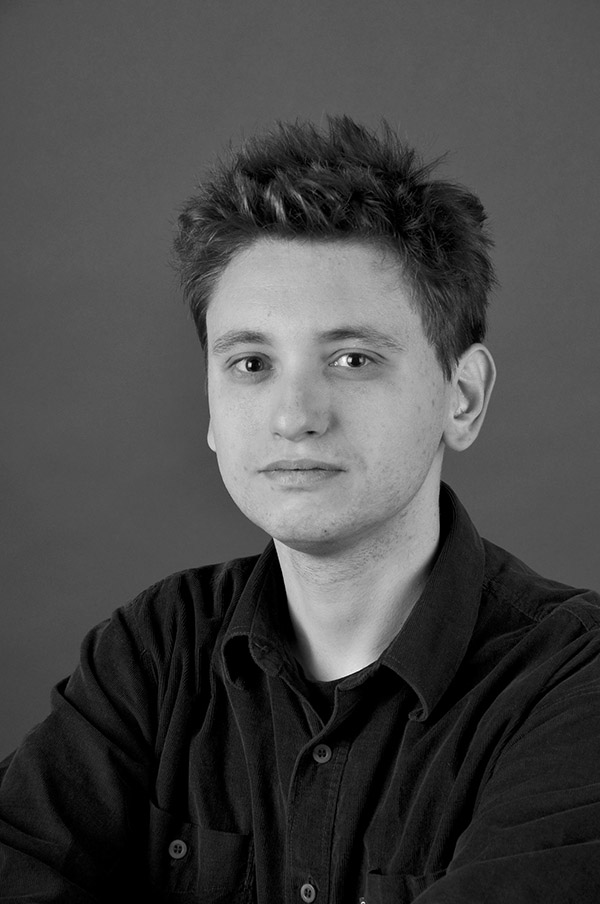
Uroš Krčadinac was born in 1984. He is a digital artist, programmer, an author, and educator. His transdisciplinary practice includes programming, writing, design, animation, and cartography. He published research papers in IEEE journals, while exhibiting artwork at the festival re:publica (Greece / Germany), University of Art and Design Emily Carr (Canada), SANU Gallery, Belgrade Museum of Science and Technology, etc. He got a PhD degree in Information technology at the University of Belgrade. He works as the assistant professor of Digital arts and computer science at the Faculty of Media and communications in Belgrade, as a research associate at UB and as an associate of the Design seminar at Petnica research center.
Through your work, you connect art, literature and computer technologies. You are also researching data visualization. Why do you think it is important to deal with such data practices?
The formative, educational, and work experience I have gained is relatively atypical: I studied computer science and organization, and I dealt with digital art and writing. For a long time I experienced it as a kind of impediment; I could even say that I suffered from the intruder syndrome. However, the older I got, the more I realized how much computer science and organization studies were fundamental to contemporary creative practices.
The systems within which we live are impenetrable and illegible to humans. I am talking about technological systems, financial, biological, geographical, climate – these are structures that directly affect our lives, but we are neither able to think of them, nor to feel them. Let’s say: how do viruses spread? How does email work? How are internet cables stretched? How do algorithms on global stock markets affect your salary and your quality of life? To us all this data is impermeable, even hermetic. Our sensorium simply did not evolve in a way that we can comprehend those systems. Despite very advanced technology, despite science, art, organization and philosophy, our emotions are still on the Paleolithic level, we are struggling to survive in the savannah in small groups.
That is why Data art is one of the answers to the multiplication of the system complexity. How to convert a huge amount of digital data into something that we can not only understand, but also sensually experience, feel, or smell?
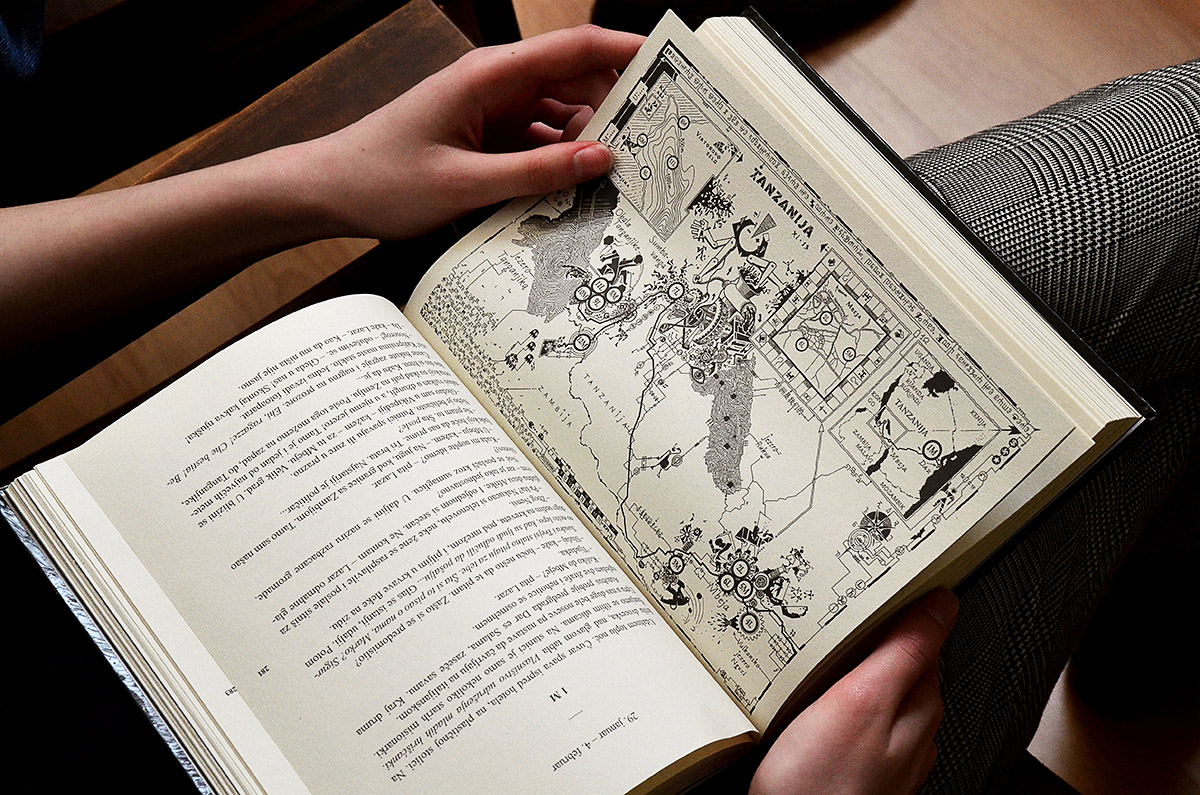
How to turn data into something tangible and concrete, something that is able to change our inner emotional life, to be an “ax for the inner sea within us ”- that is the question that interests me the most. When I design maps, when I write about travelling, when I make computer programs for generating prose and pictograms, in fact I deal with the same old question.

Data visualization and infographic design, as basically utilitarian practices that are used to visually represent chunks of information, should be separated from Data art. Data art is an author’s practice that does not have to be communicative, it doesn’t have to serve anything, but it can rethink the data-driven society the way a short story or oil on canvas does it.
But, there lies a trap as well: when we feel something, we think that we understood it better than we really did. By looking at a beautiful map of the world, we get the feeling that we understand it, when in fact we don’t. And the more exciting the map is, the greater the chance that we will overestimate our understanding of the world that the map represents. That’s why we need self-critical data practices.
Tell us more about the work you did on air pollution in Pančevo city as an example.
I worked on the project titled We Walked for 60 months four years ago. It started during a three-day workshop at a conference in Belgrade named (Graphic) Designer – An Author or a Universal Soldier. The goal of the workshop was to find the best and most innovative way to present the data base with all the information on air pollution in Pančevo. The database contained monthly air quality indexes for the period of 5 years, or 60 months, from 1998 until 2003. After going through a series of ideas, the attendees and I decided to make something physical, a work of art that can be touched, not just seen or heard.
That is how we came to the idea of mapping data on a walking path, 30 meters long, which we made right there on the spot. The trail represented a kind of a physical chart, which used landscape and construction materials instead of colors.
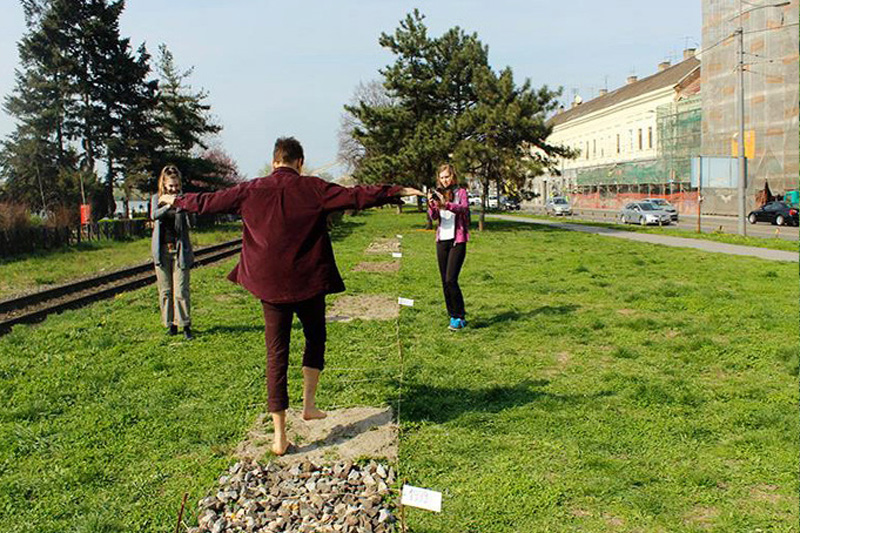
Being 1 m wide and 30 m long, our map-trail was divided into 60 segments. Each segment represented an air quality index in one month. The months when the air was good were represented by the grass segment, medium air quality was represented by sand, the gravel was there for the stifling months, while we used stones to represent the most polluted ones. By walking barefoot, attendees of the workshop and exhibition visitors could feel the long-term changes and trends in air quality over the period of 5 years.
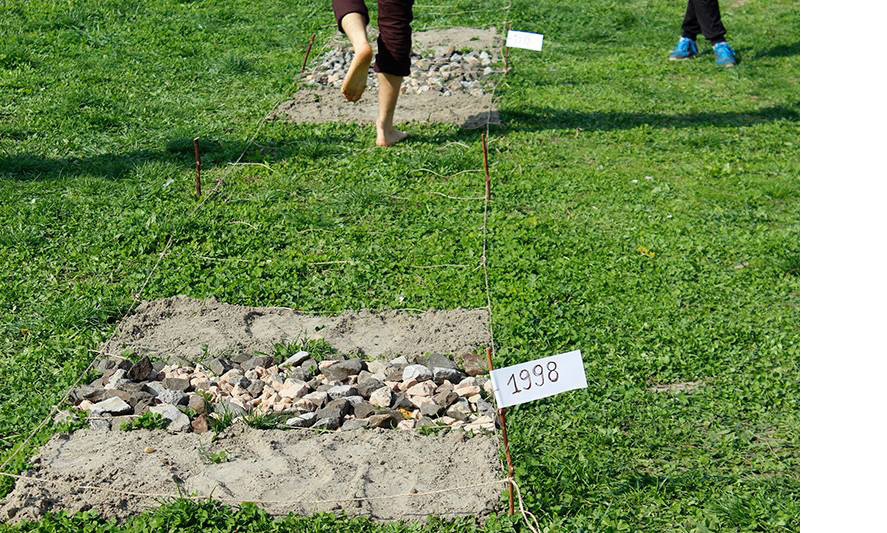
It was not possible to walk barefoot over the most polluted months without pain. I believe that, in a way, art, even design, should be able to step over the line of pain. In fact, when we look at works of art that were formative for us, from music, over movies, all the way down to digital installations, these are pieces of work that even hurt us a bit. I am afraid of an absolutely safe creativity.
What excites you the most in all the research and work that you do?
I am excited with the accelerated possibility of seeing the world in many different ways. And yes, it makes me happy and it scares me at the same time. This pandemic through which we have gone, in conjunction with the digital technologies within which we live, has ruined, in a way, all the narratives we grew up with, all the ideologies and micro-ideologies. How did the pandemic topple them? By multiplying them to infinity. All these conspiracy theories, for example, that spring up like digital mushrooms … it’s all a fractal multiplication of narratives, which are then divided into two, then into two more, and so on indefinitely. Practically everyone got their personalized narrative. One friend of mine said: we are not living at the end of history, but the paradise of history.
It is a new situation, which we are not yet able to see – and we will not be able to see it at all without the hybrid practices that connect technology and art, algorithms and society, design and science, humanities and inventions, statistics and poetry, botany and revolution.
I think the 21st century will be fundamentally hybrid. In fact, it’s already a hybrid, just we are not able to see that clearly because we are still obsessed with concepts, narratives, and ideals of the XX century.
How to connect ethics, culture and digital technologies?
Let me give you an example – when Gary Kasparov was defeated by the chess computer Deep Blue, it was Kasparov who devised the concept of Centaur chess: a chess variant in which man and computer play together against another human-computer pair. People-players use the computer to explore possible moves, to search quickly through all the different opportunities, but they make their own decisions. Maybe it would make sense to play with this kind of approach in culture, design, art, literature, theory and other areas of the human spirit.
This is the partner culture of people, algorithms and nature. Centaur culture. Centaur literature and Centaur art.
Is it one of the medicines for the Anthropocene? I don’t know, but I think it would be worth a try, because what cameras once did for the visual culture, artificial intelligence today is doing that for all areas of the human spirit.
That is why I believe that we need new digital sensibilities and new sensitivities to preserve the ability to imagine and produce meanings. I would recommend anyone who is engaged in intellectual and creative work, to learn at least something about cybernetic systems, data and machine learning. At the same time, algorithms should not think and dream instead of us. Like Centaur chess players, we need to use them for searching the space of possibilities, and we should on our own – as editors and curators – choose what of all that makes sense.

Finally, here is a short story that I generated with the help of artificial neural networks, which I trained to imitate the style of Miloš Crnjanski1. It was a kind of tribute to Stanislav Vinaver, who wrote parodies and pastiches a hundred years ago. The story was written by a machine, but together with several hundreds of other stories. As an editor and curator, I chose this one as the most successful.
she is love and wife and ladi and. she was coming
to visit. a young girl, ladi julijana. was, obvious.
she was as funny to him as paul was
petra once in his life. here you go, that is a woman,
who he had noticed. what is that, humanity?
why did he keep quiet about it, and, he thought that
his wife was his own mother and begged him for the
god to be calm.
however, it was a very short time in the house.
he was not a nice man.


